
Determining the Code Coverage of your Test Suite
description
Explanation for how to use the Zope test runner's built in code coverage features to prove the quality of your test suite.
The better your test suite’s coverage, the lower the likelihood that some modification to your code will break another piece of functionality in some unanticipated way. But, how do you know the quality of your test coverage? Zope’s test runner comes with several features to help you do just that.
But first, let’s say you’ve written some code with a Python conditional like the following:
if value % 2 == 0:
    print "This is an even number"
else:
    # we need to do some more complex
    # computation to handle odd numbers
    _someComplexCodeDealingWithOddNumbers(value)
The comments and function call in the else clause are symbolic of some advanced coding that’s required to handle all odd numbers.
Now, as you’ve no doubt learned while reading this tutorial, testing is important. But what if for one reason or another, all the test cases you’ve come up with during testing amount to even numbers when you get to the aforementioned block of code. If this were the case, you’d have a big risk of unanticipated code breakage to the way that you handle odd numbers. This is something that you’d ideally cover in your test suite.
Discovering the untested sections of your code
You’ve learned how to run your test suite in this tutorial. Zope’s test runner accepts an optional parameter called –coverage. When passed a path to a directory, Zope will generate some high-level output and produce a coverage file for each of the Python modules in your product or package.
In full, running your test suite with the coverage option enabled looks like:
./bin/instance test -s Products.productname --coverage=$HOME/coverage
Note: Running your tests with the coverage option enabled takes significantly longer (as in ~10 times or more) than without, so this is something to be done occasionally to gauge your work, rather than each time you run your tests.
At the end of running your test suite, you’ll get some immediate output like the following, which includes lines of code and your coverage percentage:
lines   cov%   module   (path)
  104   100%   $INSTANCE_HOME.parts.salesforce-integration-products.salesforcepfgadapter.Extensions.Install
               ($INSTANCE_HOME/parts/salesforce-integration-products/salesforcepfgadapter/Extensions/Install.py)
   39    41%   $INSTANCE_HOME.parts.salesforce-integration-products.salesforcepfgadapter.__init__
               ($INSTANCE_HOME/parts/salesforce-integration-products/salesforcepfgadapter/__init__.py)
    2   100%   $INSTANCE_HOME.parts.salesforce-integration-products.salesforcepfgadapter.content.__init__
               ($INSTANCE_HOME/parts/salesforce-integration-products/salesforcepfgadapter/content/__init__.py)
  168    91%   $INSTANCE_HOME.parts.salesforce-integration-products.salesforcepfgadapter.content.salesforcepfgadapter
               ($INSTANCE_HOME/parts/salesforce-integration-products/salesforcepfgadapter/content/salesforcepfgadapter.py)
   21   100%   $INSTANCE_HOME.parts.salesforce-integration-products.salesforcepfgadapter.migrations.migrateUpTo10rc1
               ($INSTANCE_HOME/parts/salesforce-integration-products/salesforcepfgadapter/migrations/migrateUpTo10rc1.py)
If all you’re looking for is a quick status report, this should suffice.
However, if you want to dig deeper, head to the directory you listed in the –coverage option. Note: The files may be preceded with dots, thus requiring an ls -a in order to reach the coverage files.
A sample file may look like the following:
    1:     def initializeArchetype(self, **kwargs):
               """Initialize Private instance variables
               """
   15:         FormActionAdapter.initializeArchetype(self, **kwargs)

   15:         self._fieldsForSFObjectType = {}


    1:     security.declareProtected(View, 'onSuccess')
    1:     def onSuccess(self, fields, REQUEST=None):
               """ The essential method of a PloneFormGen Adapter
"""
>>>>>>         logger.debug('Calling onSuccess()')
>>>>>>         sObject = self._buildSObjectFromForm(fields, REQUEST)
>>>>>>         if len(sObject.keys()) > 1:
It's really just your file with some meaningful data proceeding each line. Anything with a 1: signifies that your code was at least touched during the running of the test suite. The higher the number, the more often your code was touched. Perhaps this is intentional and signifies really good coverage in other cases, it's may be either unavoidable or could even signify that the high level of coverage wouldn't actually be required. The >>>>>> means that you've missed a line and you should consider coming up with a test scenario or more that will touch the line of code in question. The number of untested lines divided by total lines gives you your coverage percentage.
If what you really want is eye-candy
If you want pretty graphs to provide for you boss to include in a report or to make a client feel better about the quality of code they are receiving, z3c.coverage takes the contents of the output files and creates pretty summaries. Get z3c.coverage from subversion via the following:
svn co svn://svn.zope.org/repos/main/z3c.coverage/trunk z3c.coverage
Create a directory within your previously created coverage directory. We call it reports. Run the coveragereport.py module with the source being you coverage output and the destination, your newly created reports directory. See the following:
mkdir $HOME/coverage/reports
python z3c.coverage/src/z3c/coverage/coveragereport.py $HOME/coverage $HOME/coverage/reports
You should now be able to open $HOME/coverage/reports/all.html within your browser for a pretty output like the one below.
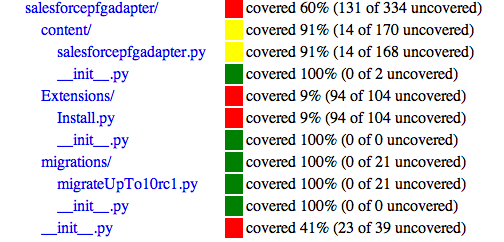
With this information available, you can start to make conclusions about how you may work your way towards better coverage of your product.